Insert a chart
- select the cell range that contains the data you wish to use for the chart,
- tap the
 icon at the top toolbar to open the new object insertion panel,
- the
 Chart tab is activated by default. Select the necessary chart type.
The chart will be added. Now you can change its properties and position.
Adjust chart settings
- select the chart by tapping it,
- open the chart settings panel by
- tapping the
 icon at the top toolbar, or
- tapping the
 option in the pop-up menu,
- tap the
 arrow next to the necessary menu item: Design, Layout, Vertical Axis, Horizontal Axis, or Reorder. Use the
  icon on the left to return to the previous settings section.
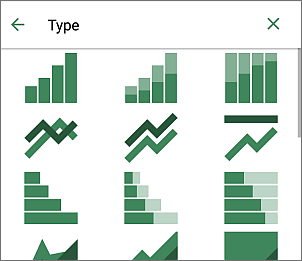
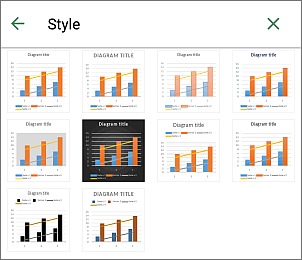
The Design section contains the following four tabs:
- Type - to change the current chart type (line chart, column chart, bar chart, area chart, pie chart, point chart, or stock chart). Swipe up to see all the chart types and tap the one you want to apply.
- Style - to change the current chart style. Swipe up to see all the available styles and tap the one you want to apply.
- Fill - to change the chart background fill by selecting a solid color. Swipe up to see all the palettes and tap the necessary color on the Theme colors or Standard colors palette or create your own Custom color. If you don't want to use any fill, tap the
 Without filling option.
- Border - to adjust the chart border Size by dragging the slider and select the border Color on the palette.
The Layout section allows you to change the layout of chart elements.
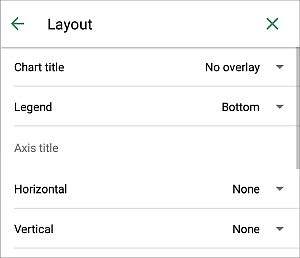
The Vertical/Horizontal axis options will not affect Pie charts since charts of this type have no axes.
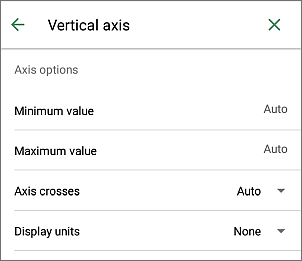
The Vertical axis section allows you to change the parameters of the vertical axis also referred to as the values axis or y-axis which displays numeric values. Note that the vertical axis will be the category axis which displays text labels for the Bar charts, therefore in this case the Vertical Axis tab options will correspond to the ones described in the next section. For the Point charts, both axes are value axes.
-
The Axis Options panel allows to set the following parameters:
- Minimum Value - is used to specify a lowest value displayed at the vertical axis start. The Auto option is selected by default, in this case the minimum value is calculated automatically depending on the selected data range. You can tap the Auto option and specify a different value.
- Maximum Value - is used to specify a highest value displayed at the vertical axis end. The Auto option is selected by default, in this case the maximum value is calculated automatically depending on the selected data range. You can tap the Auto option and specify a different value.
- Axis Crosses - is used to specify a point on the vertical axis where the horizontal axis should cross it. The Auto option is selected by default, in this case the axes intersection point value is calculated automatically depending on the selected data range. You can select the Value option and specify a different Crosses Value in the entry field that appears below, or set the axes intersection point at the Minimum/Maximum Value on the vertical axis.
- Display Units - is used to determine a representation of the numeric values along the vertical axis. This option can be useful if you're working with great numbers and wish the values on the axis to be displayed in more compact and readable way (e.g. you can represent 50 000 as 50 by using the Thousands display units). Select desired units: Hundreds, Thousands, 10 000, 100 000, Millions, 10 000 000, 100 000 000, Billions, Trillions, or choose the None option to return to the default units.
- Values in Reverse Order - is used to display values in an opposite direction. When the switcher is turned off, the lowest value is at the bottom and the highest value is at the top of the axis. When the switcher is turned on, the values are ordered from top to bottom.
-
The Tick Options section allows to adjust the appearance of tick marks on the vertical scale. Major tick marks are the larger scale divisions which can have labels displaying numeric values. Minor tick marks are the scale subdivisions which are placed between the major tick marks and have no labels. Tick marks also define where gridlines can be displayed, if the corresponding option is set at the Layout tab. The Major/Minor Type menu items contain the following placement options:
- None to not display major/minor tick marks,
- Cross to display major/minor tick marks on both sides of the axis,
- In to display major/minor tick marks inside the axis,
- Out to display major/minor tick marks outside the axis.
-
The Label Options section allows to adjust the appearance of major tick mark labels which display values. To specify a Label Position in regard to the vertical axis, select the necessary option:
- None to not display tick mark labels,
- Low to display tick mark labels to the left of the plot area,
- High to display tick mark labels to the right of the plot area,
- Next to axis to display tick mark labels next to the axis.
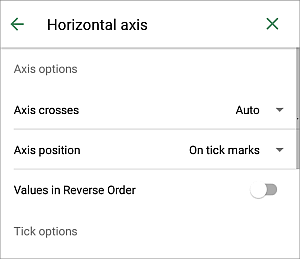
The Horizontal axis section allows you to change the parameters of the horizontal axis also referred to as the categories axis or x-axis which displays text labels. Note that the horizontal axis will be the value axis which displays numeric values for the Bar charts, therefore in this case the Horizontal Axis tab options will correspond to the ones described in the previous section. For the Point charts, both axes are value axes.
-
The Axis Options panel allows to set the following parameters:
- Axis Crosses - is used to specify a point on the horizontal axis where the vertical axis should cross it. The Auto option is selected by default, in this case the axes intersection point value is calculated automatically depending on the selected data range. You can select the Value option and specify a different Crosses Value in the entry field that appears below, or set the axes intersection point at the Minimum/Maximum Value (that corresponds to the first and last category) on the horizontal axis.
- Axis Position - is used to specify where the axis text labels should be placed: On Tick Marks or Between Tick Marks.
- Values in Reverse Order - is used to display categories in an opposite direction. When the switcher is turned off, categories are displayed from left to right. When the switcher is turned on, the categories are ordered from right to left.
-
The Tick Options section allows to adjust the appearance of tick marks on the horizontal scale. Major tick marks are the larger divisions which can have labels displaying category values. Minor tick marks are the smaller divisions which are placed between the major tick marks and have no labels. Tick marks also define where gridlines can be displayed, if the corresponding option is set at the Layout tab. You can adjust the following tick mark parameters:
- Major/Minor Type - is used to specify the following placement options: None to not display major/minor tick marks, Cross to display major/minor tick marks on both sides of the axis, In to display major/minor tick marks inside the axis, Out to display major/minor tick marks outside the axis.
-
The Label Options section allows to adjust the appearance of labels which display categories.
- Label Position - is used to specify where the labels should be placed in regard to the horizontal axis. Select the necessary option: None to not display category labels, Low to display category labels at the bottom of the plot area, High to display category labels at the top of the plot area, Next to axis to display category labels next to the axis.
The Reorder section allows to to set the selected chart position as related to other objects when several objects overlap each other. To learn more, please refer to the Manipulate objects section of this guide.
- Close the chart settings panel by tapping the
 cross on the right.
Remove the chart
Select the chart by tapping on it and proceed in one of the following ways:
- tap the
 option in the pop-up menu, or
- open the chart settings panel by tapping the
icon at the top toolbar, swipe up and tap the REMOVE CHART button.