FORECAST.ETS.STAT Function
The FORECAST.ETS.STAT function is one of the statistical functions. It is used to return a statistical value as a result of time series forecasting. Statistic type indicates which statistic is requested by this function.
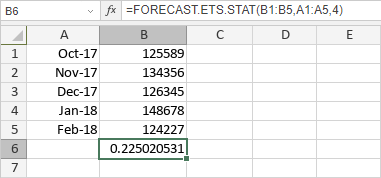
The FORECAST.ETS.STAT function syntax is:
FORECAST.ETS.STAT(values, timeline, statistic_type, [seasonality], [data_completion], [aggregation])
where
values is a range of the historical values for which you want to predict a new point.
timeline is a range of date/time values that correspond to the historical values. The timeline range must be of the same size as the values range. Date/time values must have a constant step between them (although up to 30% of missing values can be processed as specified by the data_completion argument and duplicate values can be aggregated as specified by the aggregation argument).
statistic_type is a numeric value between 1 and 8 that specifies which statistic will be returned. The possible values are listed in the table below.
| Numeric value |
Statistic |
| 1 |
Alpha parameter of ETS algorithm - the base value parameter. |
| 2 |
Beta parameter of ETS algorithm - the trend value parameter. |
| 3 |
Gamma parameter of ETS algorithm - the seasonality value parameter. |
| 4 |
MASE (mean absolute scaled error) metric - a measure of the accuracy of forecasts. |
| 5 |
SMAPE (symmetric mean absolute percentage error) metric - a measure of the accuracy based on percentage errors. |
| 6 |
MAE (mean absolute error) metric - a measure of the accuracy of forecasts. |
| 7 |
RMSE (root mean squared error) metric - a measure of the differences between predicted and observed values. |
| 8 |
Step size detected in the timeline. |
seasonality is a numeric value that specifies which method should be used to detect the seasonality. It is an optional argument. The possible values are listed in the table below.
| Numeric value |
Behavior |
| 1 or omitted |
Seasonality is detected automatically. Positive, whole numbers are used for the length of the seasonal pattern. |
| 0 |
No seasonality, the prediction will be linear. |
| an integer greater than or equal to 2 |
The specified number is used for the length of the seasonal pattern. |
data_completion is a numeric value that specifies how to process the missing data points in the timeline data range. It is an optional argument. The possible values are listed in the table below.
| Numeric value |
Behavior |
| 1 or omitted |
Missing points are calculated as the average of the neighbouring points. |
| 0 |
Missing points are treated as zero values. |
aggregation is a numeric value that specifies which function should be used to aggregate identical time values in the timeline data range. It is an optional argument. The possible values are listed in the table below.
To apply the FORECAST.ETS.STAT function,
- select the cell where you wish to display the result,
- click the Insert function icon situated at the top toolbar,
or right-click within a selected cell and select the Insert Function option from the menu,
or click the icon situated at the formula bar,
- select the Statistical function group from the list,
- click the FORECAST.ETS.STAT function,
- enter the required arguments separating them by commas,
- press the Enter button.
The result will be displayed in the selected cell.
Alla pagina precedente